Shift Optimization Problem#
The shift optimization problem is the problem of finding the optimal cost under several constraints. Here we show an example of shift optimization based on This formulation.
Problem Description#
Overview#
Suppose that we want to allocate multiple jobs to multiple workers. You have to pay a cost per worker. Given the start time and end time of each job and the costs of each worker, minimize the workers’ cost under the constraints;
Each job needs one worker
A worker cannot do multiple jobs at the same time
The figure below is a picture of the shift optimization problem.
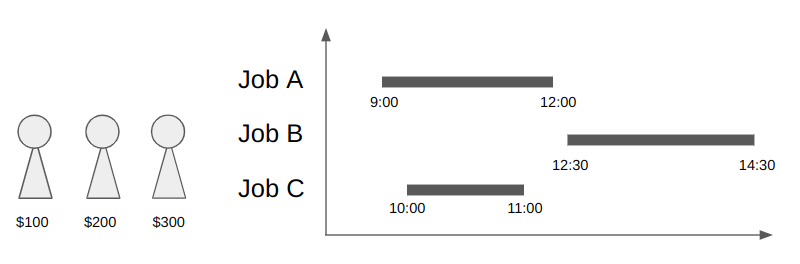
There are three jobs and three workers in this situation. Since job A and B have no overlap, one worker can do these jobs, costing a total of $300.
Pre-process#
Before constructing a mathematical model, we list overlapping jobs from the given job schedule. First, we prepare the job scheduling data (list of (start_time, end_time)):
from datetime import time
job_list = [
        (time(17, 0), time(18, 0)), # job 0
        (time(13, 0), time(14, 0)), # job 1
        (time(13, 30), time(14, 30)), # job 2
        (time(13, 40), time(14, 40)), # job 3
        (time(16, 40), time(17, 40)), # job 4
        (time(11, 40), time(13, 40)), # job 5
        (time(18, 40), time(19, 40)), # job 6
        (time(18, 40), time(19, 40)), # job 7
        (time(18, 00), time(19, 00)), # job 8
    ]
To find overlapping jobs, we first create a graph whose node i corresponds to each job job_list[i], and the edge connects overlapping jobs.
We need the networkx library to run the below code.
import networkx as nx

def has_overlap(t1start: time, t1end: time, t2start: time, t2end: time):
    return (t1start <= t2start <= t1end) or (t2start <= t1start <= t2end)

def gen_index_graph(time_list: list[tuple[time, time]]) -> nx.Graph:
    G = nx.Graph()
    for j in range(len(time_list)):
        for k in range(j + 1, len(time_list)):
            if has_overlap(
                time_list[j][0], time_list[j][1], time_list[k][0], time_list[k][1]
            ):
                G.add_edge(j, k)

    return G
g = gen_index_graph(job_list)
nx.draw_networkx(g, with_labels=True)
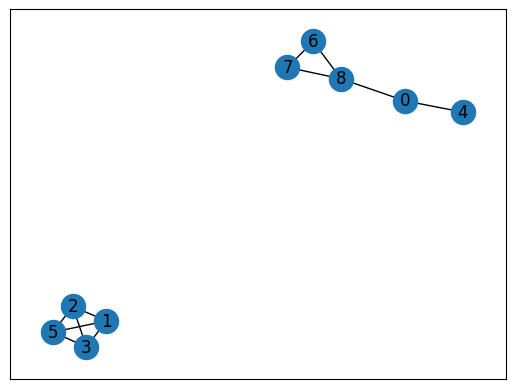
We can get the list of overlapping jobs by finding cliques from the graph. The function nx.find_cliques can be used for extracting cliques.
job_cliques = []
for c in nx.find_cliques(g):
    job_cliques.append(list(set(c)))

print(job_cliques)
[[0, 8], [0, 4], [1, 2, 3, 5], [8, 6, 7]]
For example, job 0 (from 17:00 to 18:00) and job 8 (from 18:00 to 19:00) has overlap at 18:00 hence it listed as [0, 8].
Job 1, 2, 3, 5 are overlapped each other hence it is also listed.
Mathematical Model#
Let us formulate the mathematical model for the shift optimization problem. The problem setting and formulation in this section are based on the example of shift optimization problem.
Constants#
We use the following constants:
\(W\): The number of workers (e.g.
5)\(J\): The number of jobs (e.g.
5)\(b_w\): Costs of the worker w. (e.g.
[1,2,3,2,1])\(C\): List of overlapped jobs (e.g.
[[1,4], [4,2,3,5], [2,3]]. Note that \(C_0\) =[1,4], \(C_1\) =[4,2,3,5], \(C_2\) =[2,3])\(Nc\): The number of overlapped jobs (=
len(C))
Decision Variables#
A binary variables \(x_{j,w}\) and \(y_{w}\) are defined as:
for all \(j \in \{0, ..., J-1\}\) and \(w \in \{0, ..., W-1\}\).
Objective Functions#
The cost function to be minimized is the total cost of workers:
Constraints#
We first consider two constraints;
Each job needs one worker
A worker cannot do multiple jobs at the same time. In other words, the number of jobs in \(C_c\) that the worker \(w\) is assigned is 0 (if \(y_{w}\) is 0) or 1 (if \(y_{w}\) is 1).
Modeling by JijModeling#
import jijmodeling as jm

problem = jm.Problem("shift schedule")

W = problem.Natural("W")
J = problem.Natural("J")
b = problem.Float("b", shape=(W,))
C = problem.Natural("C", less_than=J, ndim=2, jagged=True)
Nc = problem.NamedExpr("Nc", C.len_at(0))

y = problem.BinaryVar("y", shape=(W,))
x = problem.BinaryVar("x", shape=(J, W))

problem += jm.sum(W, lambda w: b[w] * y[w])

problem += problem.Constraint("const_do_all_jobs", lambda j: jm.sum(W, lambda w: x[j, w]) == 1, domain=J)

problem += problem.Constraint(
    "const_worker_limit", lambda w, c: jm.sum(C[c], lambda l: x[l, w]) <= y[w], domain=(W, Nc)
)

problem
Solve by JijZeptSolver#
Let us compute with five workers and five jobs.
workers_costs = [1, 4, 3, 2, 5]
job_list = [
        (time(17, 0), time(18, 0)),
        (time(13, 0), time(14, 0)),
        (time(13, 30), time(14, 30)),
        (time(13, 40), time(14, 40)),
        (time(16, 40), time(16, 50)),
    ]

# Pre-process to job_list
g = gen_index_graph(job_list)
job_cliques = []
for c in nx.find_cliques(g):
    job_cliques.append(list(set(c)))

instance_data = {
            "W": len(workers_costs),
            "J": len(job_list),
            "b": workers_costs,
            "C": job_cliques,
        }
import jijzept_solver

instance = problem.eval(instance_data)
solution = jijzept_solver.solve(instance, solve_limit_sec=1.0)
Visualization#
First, let us check the objective (the cost function) of the solution obtained.
solution.objective
6.0
Next, we visualize the assigned work to workers.
import matplotlib.pyplot as plt

def plot_sol(job_list: list[tuple[time, time]], y: list[int], x: list[list[int]]):
    factor = 24 / 86400
    bar_job_list = [
        (
            (e1.hour*3600 + e1.minute*60 + e1.second) * factor,
            ((e2.hour*3600 + e2.minute*60 + e2.second) - (e1.hour*3600 + e1.minute*60 + e1.second)) * factor
        )
        for e1, e2 in job_list
    ]

    _, ax = plt.subplots()
    for i, val in enumerate(y):
        if val == 1:
            bar = []
            for j in range(len(bar_job_list)):
                if [j, i] in x:
                    bar.append(bar_job_list[j])

            ax.broken_barh(bar, (10*(i+1)-2.5, 5))

    ax.set_xlim(0, 24)
    ax.set_xlabel("job schedule time [Hour]")
    ax.set_yticks([10*(i+1) for i,_ in enumerate(y)], labels=[f"workers {i}" for i,_ in enumerate(y)])  # Modify y-axis tick labels
    ax.grid(True)

    plt.show()
df = solution.decision_variables_df
solution_y = df[df["name"] == "y"]["value"].to_list()
solution_x = df[(df["name"] == "x") & (df["value"] == 1)]["subscripts"].to_list()
plot_sol(job_list, solution_y, solution_x)
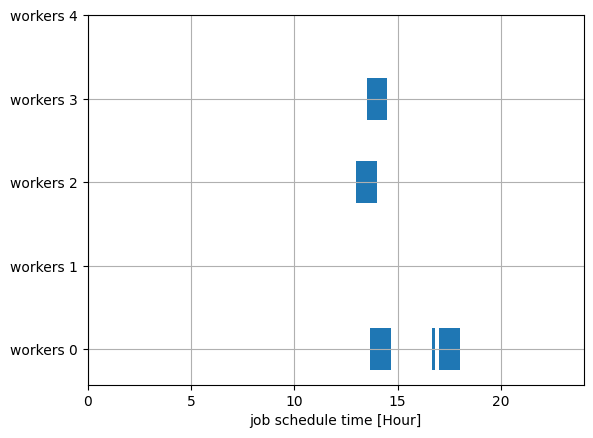
The blue area shows the assigned jobs. We can see that we only need to assign work to workers 0, 2, and 3. Since the wage for worker 0 is 1, for worker 2 is 3, and for worker 3 is 2, the total wage is 1+2+3=6. This assignment results in the minimum total wage.
Other Cases#
Let us consider if all jobs are overlapped.
workers_costs = [1, 4, 3, 2, 5]
job_list = [
        (time(10, 10), time(19, 0)),
        (time(10, 20), time(19, 0)),
        (time(10, 30), time(19, 30)),
        (time(10, 0), time(19, 40)),
        (time(10, 0), time(19, 50)),
    ]

# Pre-process to job_list
g = gen_index_graph(job_list)
job_cliques = []
for c in nx.find_cliques(g):
    job_cliques.append(list(set(c)))

instance_data = {
            "W": len(workers_costs),
            "J": len(job_list),
            "b": workers_costs,
            "C": job_cliques,
        }


instance = problem.eval(instance_data)
solution = jijzept_solver.solve(instance, solve_limit_sec=1.0)
df = solution.decision_variables_df
solution_y = df[df["name"] == "y"]["value"].to_list()
solution_x = df[(df["name"] == "x") & (df["value"] == 1)]["subscripts"].to_list()
plot_sol(job_list, solution_y, solution_x)
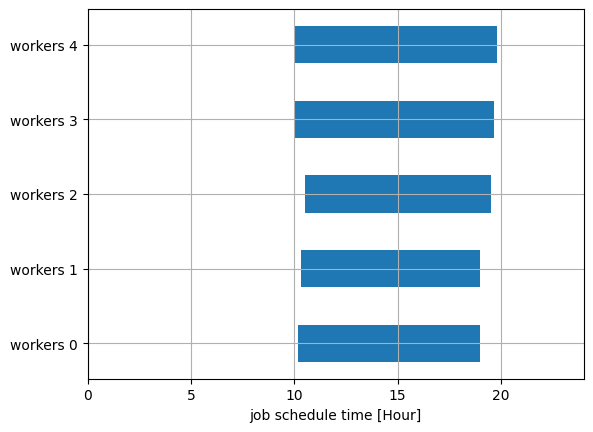
In this case, we need all workers to finish jobs.